8 Years of Reading using StoryGraph (2015 to 2022)
Recently discovered StoryGraph from watching Jack Edwards' yearly book review video. Cool to see that he still uploads interesting videos and pivoted to fully focusing on books instead of other random stuff.
I used to use Goodreads to track my books but stopped sometime in 2019 or 2020. The UI was just horrible and looked like it was from 2008. It was also really buggy and unpleasant to use. So that's why I switched to The StoryGraph to track my books. Conveniently there's an option to import all my data from Goodreads. The nice thing about StoryGraph is that it has a feature that allows you to see overall reading stats. So let's explore (This is for books I read from 2015 to 2022. There's a couple of books I forgot to track in Goodreads in 2020/21 and missing a bunch from before I discovered goodreads in 2018)
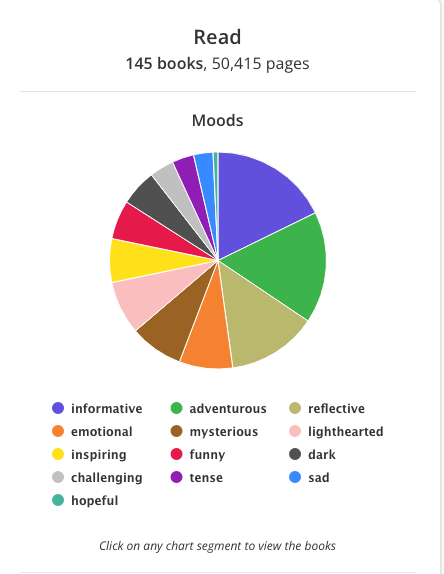
The coolest stat to me is the number of pages read. 50415 pages and the average page in a book contains 300 words. The average reading speed is 300 WPM so it takes one minute to read one page. That means I have spent roughly 50,415 minutes reading which is 840.25 hours or 35 entire days of reading. That seems like a lot but over 8 entire years, it's not much.
24 hours in a day
roughly 8 hours of sleep
roughly 8 hours of school
so 8 hours left in a day and 35 days over the course of 8 years is 0.28775685 hours per day or 17 minutes a day.
17/480
0.03541667
3% of the time outside of sleep/school
1% of all time in past 8 years
surprising
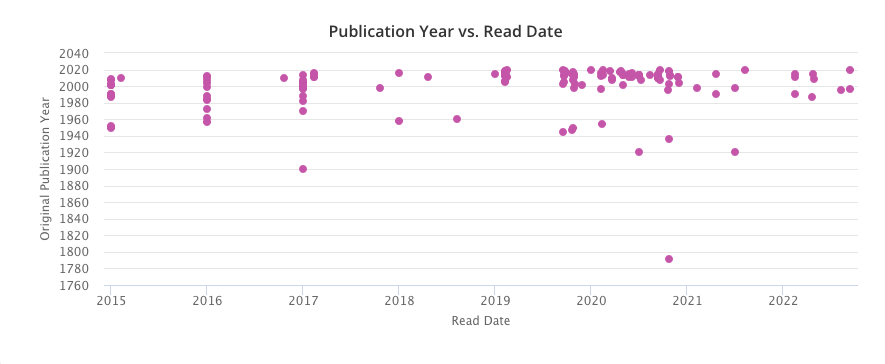
For reference this genre list for 2022 more properly summarises the type of books I am currently interested in reading. Most obvious shift is from YA/SelfHelp (2019/2020) to more history/business/biography (2021/2022) and a SHARP decline in number of books read due to low interest rates (thanks jpow).
Anyways, I prefer lower interest rates but until then its time to read more


